Marketing
Stop Guessing and Start Growing with Shopify Analytics
May 28, 2026
Why Shopify Analytics and Reporting Matters for Every Store
Shopify analytics and reporting is Shopify's built-in system for tracking your store's sales, traffic, customer behavior, and marketing performance — all from a single dashboard with no technical setup required.
Here's a quick snapshot of what it covers:
Feature | What It Does |
|---|---|
Overview Dashboard | Customizable cards showing key metrics at a glance |
Reports (60+) | Deep dives into sales, customers, marketing, behavior, inventory, and finances |
Live View | Real-time map of active visitors and orders as they happen |
Marketing Reports | Attribution models to see which channels drive conversions |
Plan-Based Access | More advanced reports unlock on higher Shopify plans |
Available on every Shopify plan, it gives store owners a unified view of performance without needing a developer or a separate analytics tool. But — and this is important — what you can see, and how accurate it is, depends heavily on your plan and how your store is set up.
Most store owners open their analytics dashboard, glance at total sales, and move on. That's understandable. Running a store is busy work. But that habit leaves a lot of valuable insight on the table — insight that could directly affect your revenue, your marketing spend, and your customer retention.
The difference between stores that grow consistently and those that plateau often comes down to one thing: whether the owner is asking the right questions of their data.
Businesses that set goals and track them consistently are 96% more likely to hit at least some of those goals — and 41% more likely to hit all of them. That's not a coincidence. It's what happens when decisions are driven by data instead of gut feeling.
I'm Ross Plumer, a digital marketing and Shopify development specialist who has worked with businesses marketing over $20 million in revenue — and Shopify analytics and reporting is one of the first things I audit with every new client. In this guide, I'll walk you through exactly how the platform's reporting system works, where it shines, and where you'll need to fill in the gaps.
What Shopify Analytics Is and How It Works
At its core, shopify analytics and reporting is a commerce-first data platform. Unlike general tools that track "hits," Shopify focuses on "transactions." It processes every event in your store—from a customer landing on your home page to the final payment confirmation—and turns that raw data into readable reports.
The beauty of this system is that it requires zero setup. As soon as you launch your store, Shopify begins collecting data. You can access this by navigating to the "Analytics" section in your Shopify admin. For those who want to go deeper, Shopify recently overhauled its infrastructure to allow for more flexible data exploration. You can now use ShopifyQL (a query language built specifically for commerce) or even Sidekick, Shopify’s AI assistant, to ask questions like, "What were my top-selling products in London last month?"
The Core Components: Overview Dashboard, Reports, and Live View
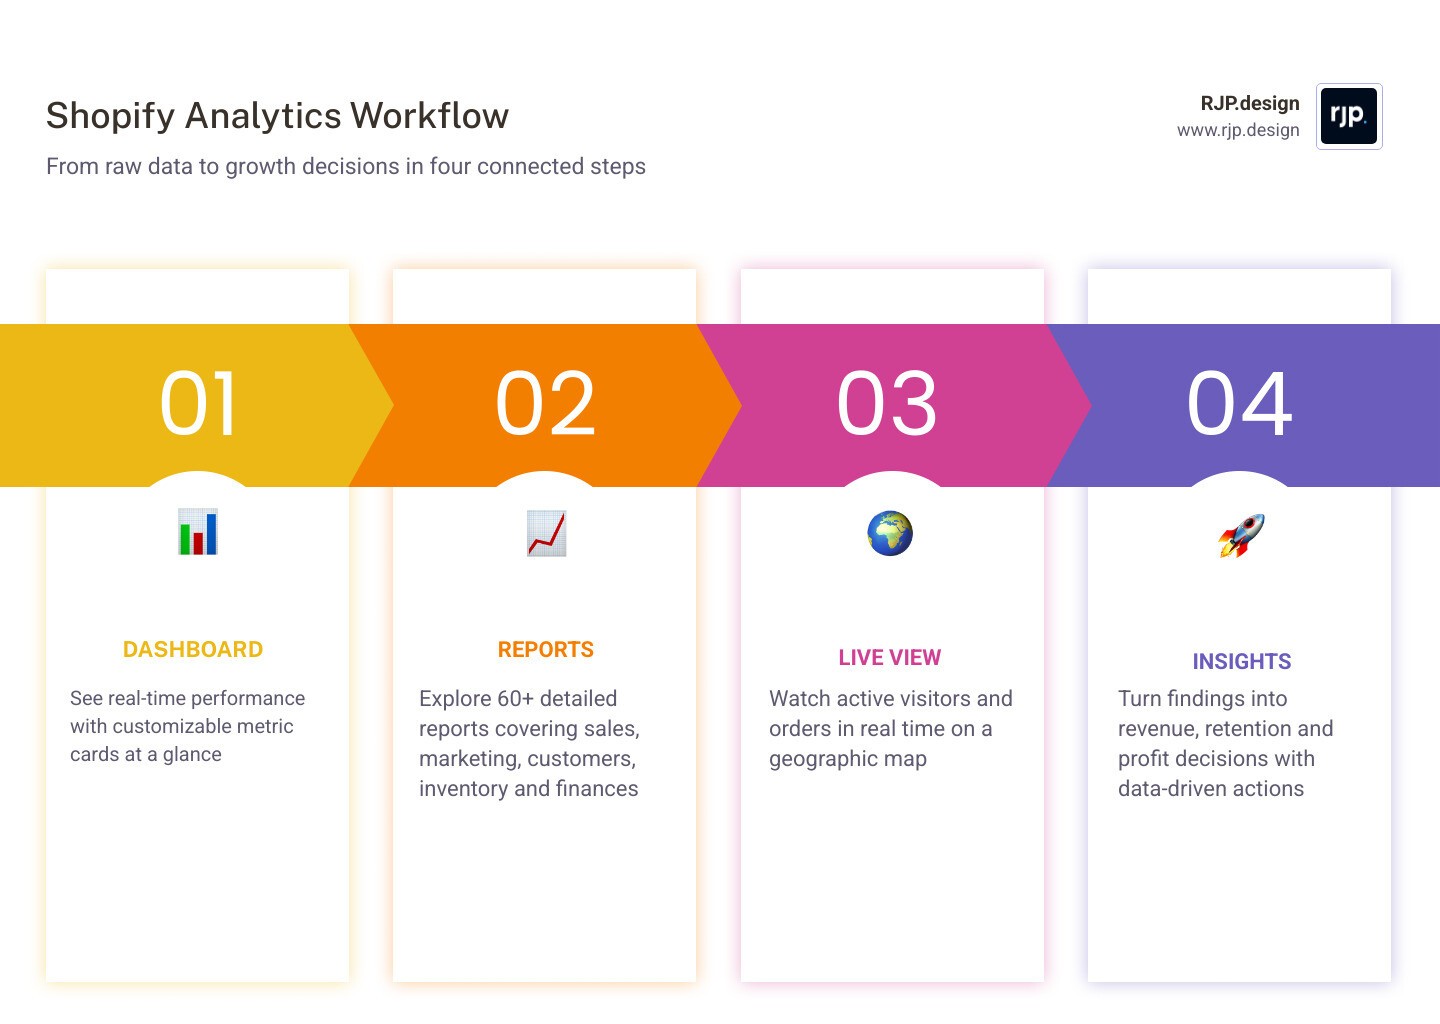
The system is divided into three main areas that serve different purposes for your business:
Overview Dashboard: This is your "mission control." It uses customizable metric cards to show you a high-level summary of your performance. You can drag, resize, and add cards like Total Sales, Conversion Rate, and Sessions to see what matters most to you the moment you log in.
Reports Page: This is the library where you’ll find over 60 pre-built reports. It’s categorized into sections like Sales, Acquisition, and Behavior. If a pre-built report doesn't quite fit, you can customize it by layering additional metrics or dimensions.
Live View: This is the most addictive part of the platform. It shows a real-time map of who is on your store right now, where they are located, and when they make a purchase. It’s particularly useful during flash sales or Black Friday to monitor traffic spikes and order flow.
For a deeper dive into how these dashboards function, you can explore the official Shopify Analytics and Reporting Dashboards.
What You Can Measure in Shopify Analytics and Reporting
If you can sell it, Shopify can probably measure it. The platform offers a massive range of reports that cover every corner of an ecommerce business. However, it’s easy to get overwhelmed by the sheer volume of data.
The Most Important Metrics and Reports to Watch First
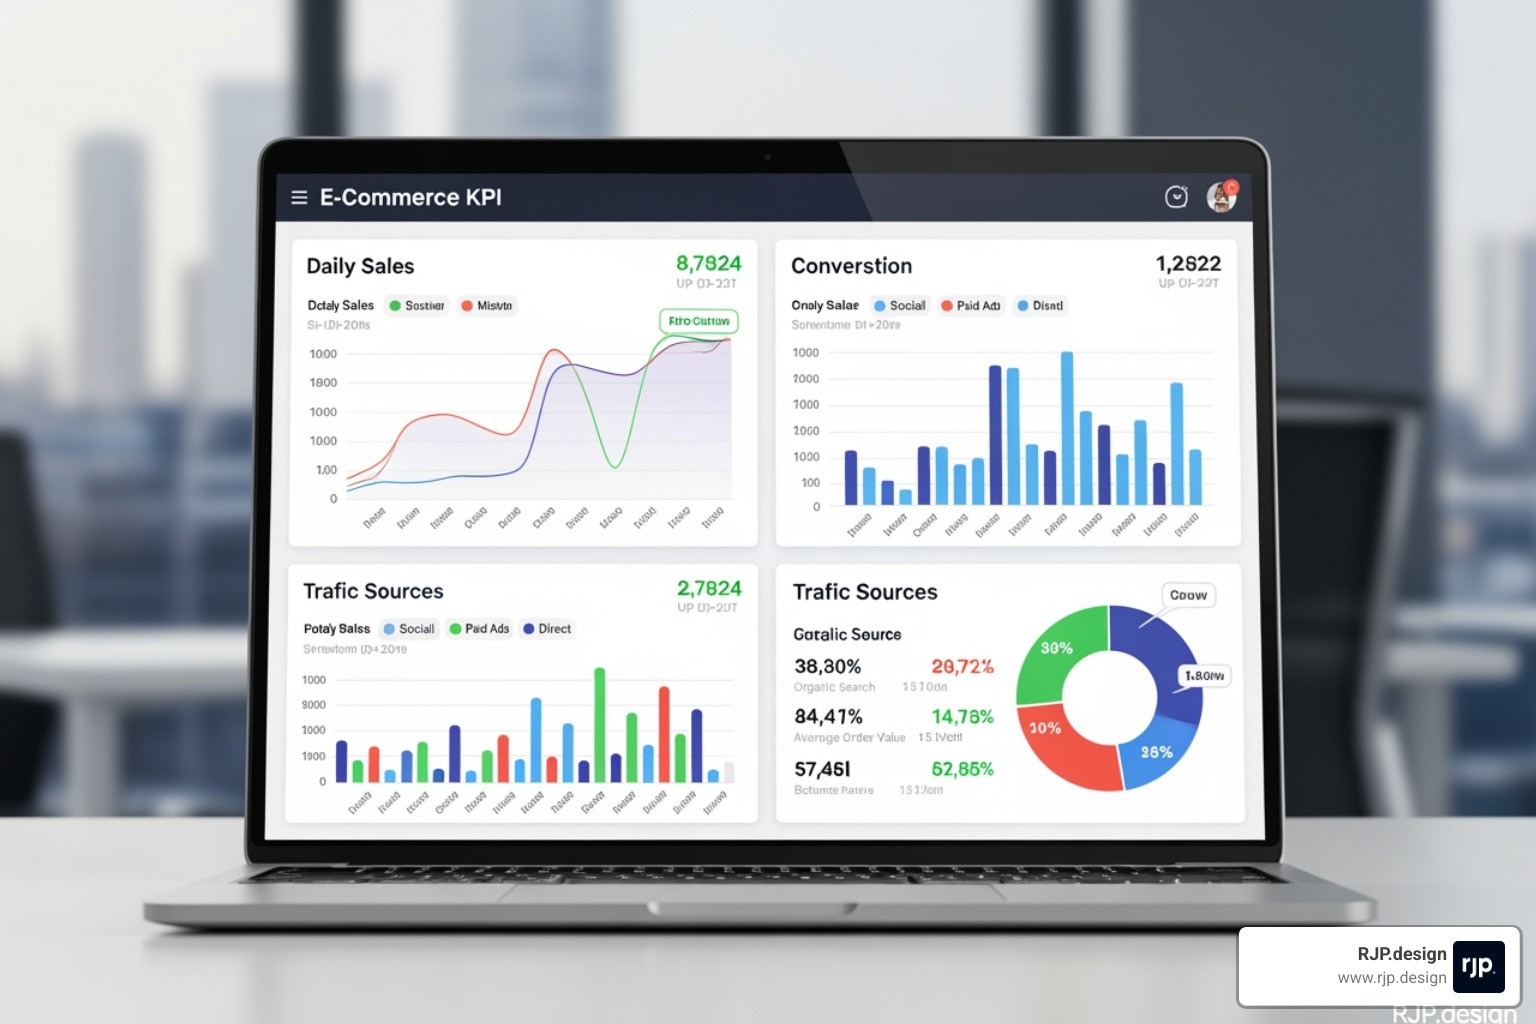
To keep your sanity, we recommend focusing on these "Big Five" metrics within your shopify analytics and reporting suite:
Total Sales & AOV (Average Order Value): Are you making money, and is the value of each order increasing?
Online Store Conversion Rate: This is the ultimate health check for your website design. If this is below 1.75% (the Shopify average), you might have a "leaky funnel."
Sessions by Referrer: Where is your traffic coming from? Is it Instagram, Google Ads, or direct?
Returning Customer Rate: It is much cheaper to keep a customer than to find a new one. Aim for a rate above 25-30%.
Inventory Days Remaining: This tells you how much longer your current stock will last based on your recent sales rate—essential for avoiding "out of stock" messages.
How Reporting Changes Across Shopify Plans
Not all reporting is created equal. Shopify restricts certain advanced data features based on your monthly subscription plan.
Feature | Basic ($39/mo) | Shopify ($105/mo) | Advanced ($399/mo) |
|---|---|---|---|
Standard Reports | Limited | Full Access | Full Access |
Custom Reports | No | No | Yes |
Profit Reports | No | Yes | Yes |
Cohort Analysis | No | No | Yes |
Data Retention | 13 Months | 13 Months | 13 Months |
If you are on the Basic plan, you'll get the essentials, but you won't be able to create custom reports or see detailed profit margins. For growing brands, the jump to the Advanced plan is often justified just for the cohort analysis, which tracks customer behavior over time to measure true Lifetime Value (LTV).
Where Native Reports Fall Short and Why Data Doesn’t Always Match
No analytics tool is perfect. You might notice that your Shopify sales don't match your Google Analytics 4 (GA4) data. In fact, Shopify attribution can misalign with GA4 by 20–30% in many cases.
Why does this happen?
Cookie Consent: If a visitor declines your cookie banner, Shopify (and GA4) might not track their session, leading to underreported traffic.
Attribution Gaps: Shopify often defaults to "Last non-direct click" attribution. If a customer clicks a Facebook ad but buys three days later via a direct link, the credit might be split or lost depending on the model you look at.
Time Delays: While sales reports update in about a minute, marketing reports can take up to 24 hours to fully populate.
Historical Limits: Shopify generally only stores 13 months of data for most reports unless you manually export them.
For more technical details on how Shopify handles these nuances, check the Marketing reports and Sales reports documentation.
How to Turn Shopify Reports Into Better Growth Decisions
Data is just noise until you use it to change something. At RJP.design, we believe that great design and great data go hand-in-hand. You can have the most beautiful store in the world, but if the data shows people are dropping off at the shipping page, the design isn't doing its job.

Best Practices for Using Reports to Grow Revenue, Retention, and Profit
To turn your shopify analytics and reporting into a growth engine, follow these habits:
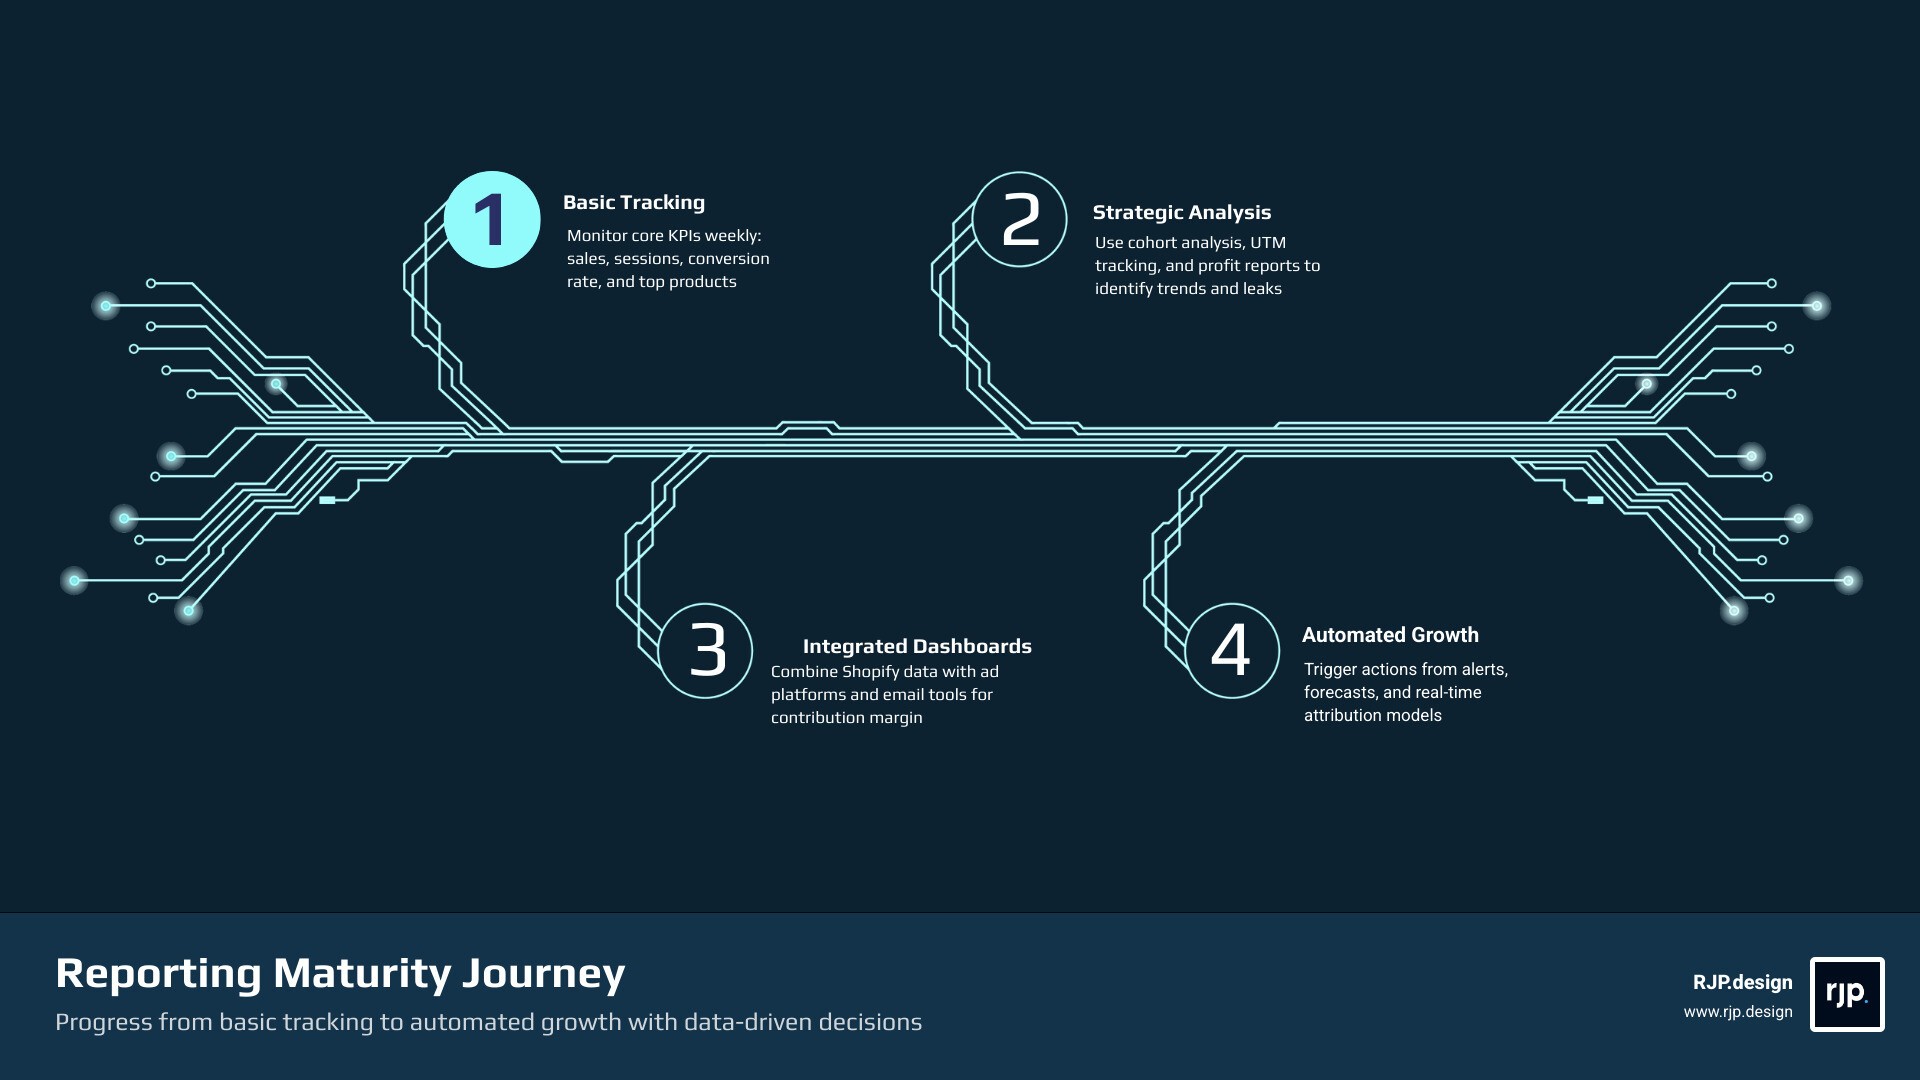
Weekly KPI Checks: Don't look at data every hour (unless it's a holiday sale). Check your metrics once a week to spot trends.
Use UTM Parameters: Always tag your marketing links. This ensures Shopify knows exactly which email or ad drove the sale.
Analyze the "Why": If sales are down, look at the Behavior reports. Is the bounce rate high on your landing page? Maybe the page is too slow or the mobile layout is broken.
Protect Your Margins: Use the Profit reports (available on Shopify plan and up) to ensure that after shipping, discounts, and COGS, you are actually making a profit.
If you're looking for inspiration on how high-performing stores structure their layout to maximize these metrics, check out these Best Shopify Store Designs.
When to Move Beyond Native Shopify Reporting
As your brand scales toward $1 million and beyond, you might find Shopify’s native tools a bit restrictive. You should consider moving to custom dashboards or ELT (Extract, Load, Transform) tools when:
You need to combine Shopify data with Amazon, Meta Ads, and Klaviyo in one view.
You want to see more than 13 months of historical trends.
You need to calculate "Contribution Margin" (profit after all variable costs, including marketing).
You are managing multiple stores and need a unified "Global" view.
Shopify's Reimagined Analytics has made the platform more flexible, but for enterprise-level brands, a dedicated data warehouse is often the next logical step. You can learn more about the transition from basic reporting to advanced analysis in this Beginner's Guide to Using Shopify Reports.
A Simple Next Step for Stores Ready to Improve Reporting
If all of this feels a bit overwhelming, don't worry—you don't have to be a data scientist to run a successful store. The first step is simply to stop guessing. Start by picking three metrics that matter to you this month and track them every Monday.
At RJP.design, we help merchants bridge the gap between "having data" and "having a strategy." Whether you need a dashboard cleanup or a complete store optimization to improve those conversion rates you're seeing in your reports, our team is here to help.
Ready to take your store to the next level? Explore how our Shopify Ecommerce Development Agency can help you turn your analytics insights into a high-converting reality.