Web
From Clicks to Insights: How to Analyze Your Website Traffic
May 30, 2025

Website Traffic Analysis: 7 Powerful Ways for Success 2025
Why Website Traffic Analysis Transforms Your Business
Website traffic analysis is the process of collecting and examining data about your website visitors to understand their behavior, preferences, and journey through your site. Here’s what you need to know:
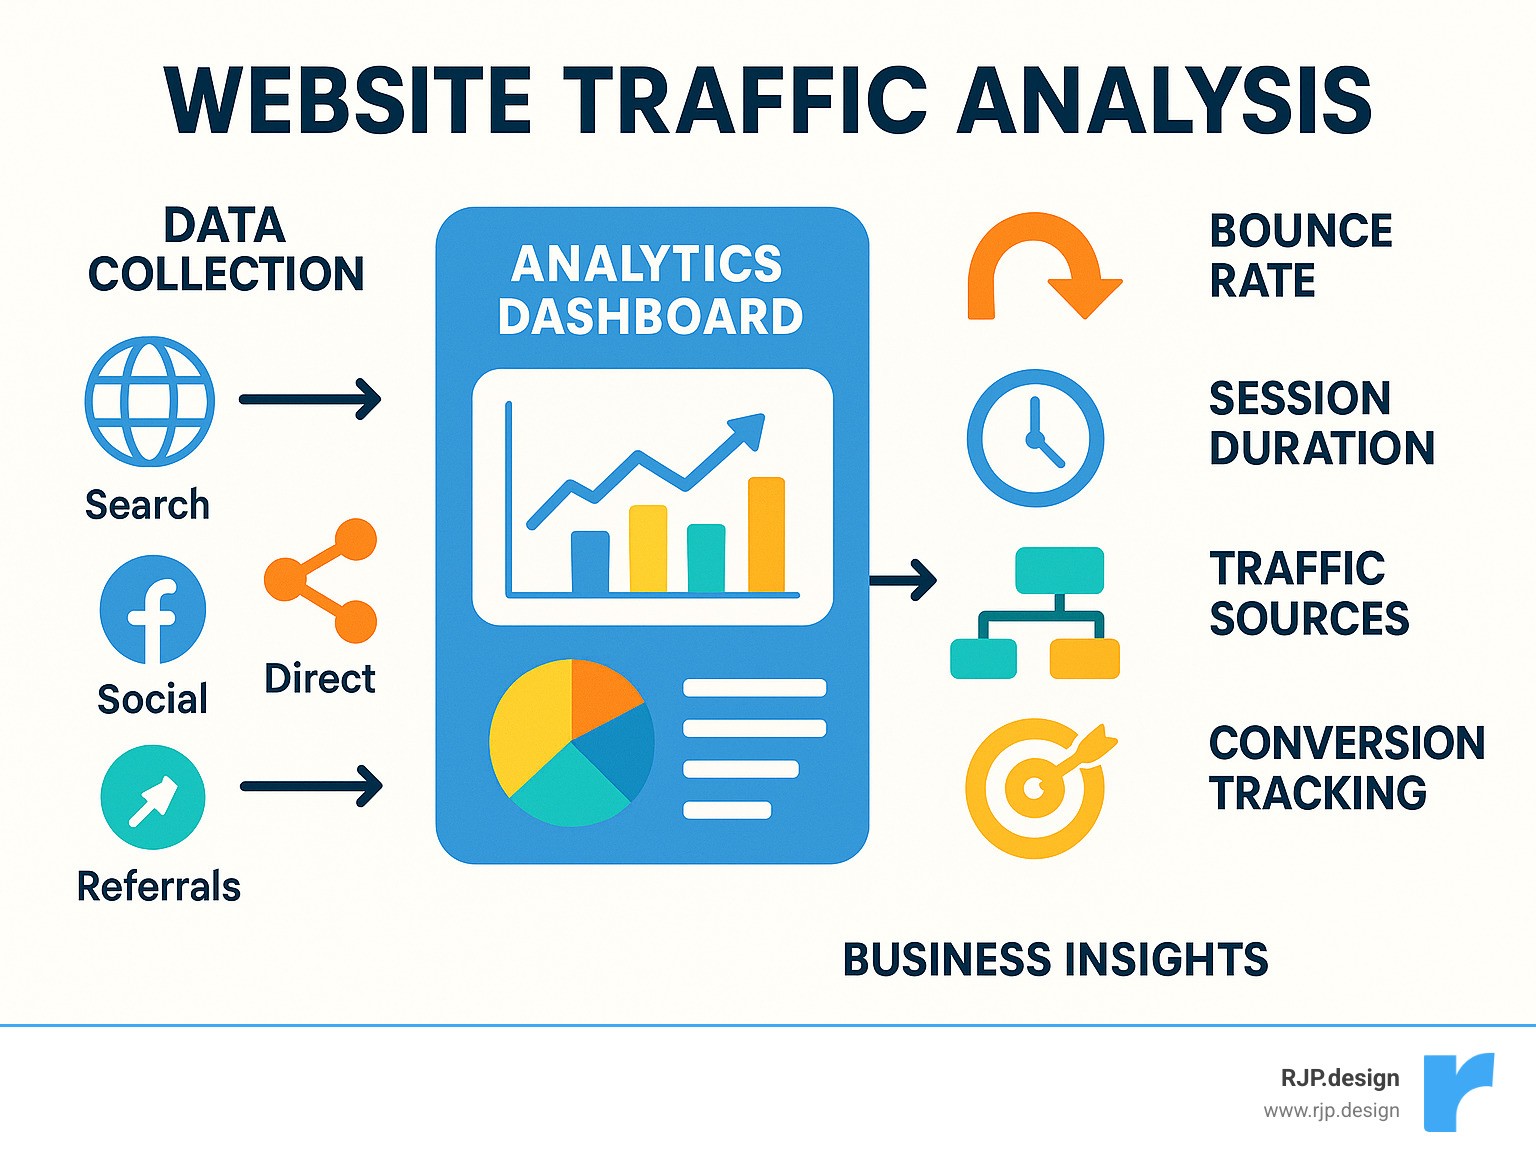
Key Components of Website Traffic Analysis:
• Traffic Volume – Total visitors, sessions, and pageviews
• Traffic Sources – Where visitors come from (search, social, direct, referrals)
• User Behavior – How long visitors stay, which pages they visit, bounce rates
• Conversions – Actions visitors take (purchases, form fills, downloads)
• Demographics – Geographic location, device type, and audience characteristics
The data tells a powerful story. Research shows that 20% of users may visit an online store more than once in a month, while the average website bounce rate hovers around 40%. These insights help you understand what’s working and what needs improvement.
Website traffic analysis matters because it reveals the truth about your digital presence. You’ll find which marketing channels drive quality visitors, identify pages that lose potential customers, and uncover opportunities your competitors might be missing.
Why analyze your traffic? Simple – it turns guesswork into strategy. Instead of wondering why sales are slow or which marketing efforts pay off, you get clear answers backed by real data.
I’m Ross Plumer, and I’ve helped businesses that have marketed over $20 million in revenue use website traffic analysis to make smarter decisions and drive growth. My experience working with high-revenue companies has shown me how the right data insights can transform struggling websites into customer magnets.
Quick website traffic analysis terms:
Why Traffic Data Matters
Traffic data is your window into customer behavior. When we analyze bounce rates, session duration, and conversions, we’re essentially reading the digital body language of your visitors. A high bounce rate of 82.52% means only 17.48% of visitors stay on your website for more than 15 seconds – that’s a clear signal something needs fixing.
The majority of visitors now browse on mobile devices, making mobile optimization crucial for keeping visitors engaged. Understanding these patterns helps us create websites that not only look great but actually convert visitors into customers.
Understanding Website Traffic Analysis
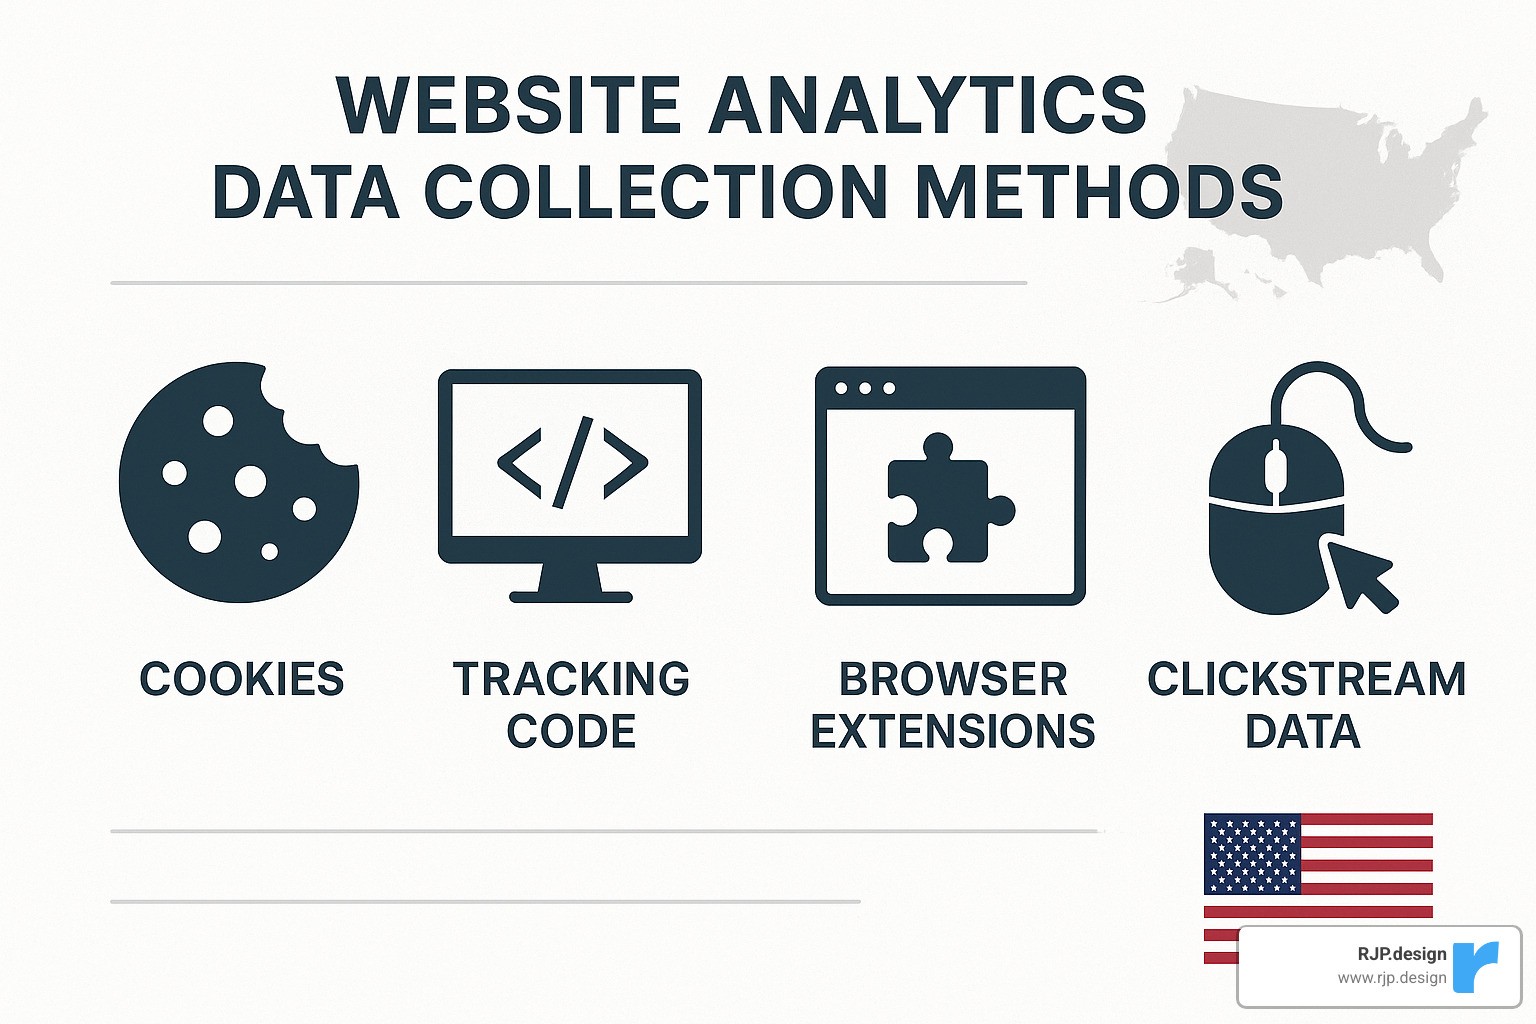
Think of website traffic analysis as detective work for your digital presence. Every click, scroll, and page visit leaves a trail of clues about what your visitors want and how they behave. This data collection happens through several methods, including cookies that remember user preferences, clickstream data that tracks the path visitors take through your site, and tracking codes that measure engagement.
The beauty of modern analytics is that it collects this information while protecting user privacy. Apps, browser extensions, and tracking codes work quietly in the background, gathering insights about how users steer between pages and how much time they spend exploring your content.
What Is Website Traffic Analysis?
Website traffic analysis is like having a conversation with your website visitors – except they’re telling you everything through their actions instead of words. It’s the systematic way of examining visitor data to understand how people interact with your website.
The foundation of this analysis rests on three key measurements: sessions, users, and demographics. A session represents a group of interactions within a specific timeframe – imagine someone visiting your site, reading a few blog posts, and maybe filling out a contact form. All of that activity counts as one session, even though it includes multiple pageviews.
Here’s something that trips up many business owners: sessions typically end after 30 minutes of inactivity. So if someone visits your site in the morning, then returns in the afternoon, that’s two separate sessions from the same user. Understanding this distinction helps you make sense of your data and avoid common misinterpretations.
Core Benefits for Businesses
The real magic happens when you transform raw traffic data into business insights. Website traffic analysis delivers three game-changing benefits that can reshape your entire digital strategy.
Target market development becomes crystal clear when you can see exactly who visits your site. Instead of guessing about your ideal customer, you’ll know their location, device preferences, and browsing habits. This insight helps you create content and offers that speak directly to your actual audience.
ROI optimization through channel attribution shows you which marketing efforts actually pay off. You might find that your expensive social media ads generate lots of traffic but few conversions, while your humble blog posts quietly drive high-quality leads. This knowledge lets you shift your budget toward what works.
Competitive advantage emerges when you understand user behavior patterns that your competitors miss. Maybe you’ll find that visitors who read certain pages are 50% more likely to convert, or that mobile users prefer different content than desktop visitors. These insights become your secret weapon for outperforming the competition.
Website Traffic Analysis Frequency
The question isn’t whether to analyze your traffic – it’s how often to dig into the data. Smart businesses use a three-tiered approach that balances staying informed with avoiding data overload.
Daily monitoring keeps you alert to sudden changes. Maybe your site crashes, a blog post goes viral, or a marketing campaign launches successfully. Quick daily checks help you catch opportunities and problems while you can still act on them.
Weekly reporting reveals patterns that daily snapshots miss. You’ll spot trends in traffic sources, identify which content resonates with your audience, and track campaign performance over meaningful timeframes.
Monthly analysis is where the big picture comes together. This deeper dive helps you evaluate overall strategy, set goals for the coming month, and make major decisions about website improvements or marketing direction.
The most successful businesses I work with set up automated alerts for significant traffic changes, then stick to a regular analysis schedule. This approach keeps them informed without getting lost in the data weeds.
Essential Metrics & What They Mean
Think of website traffic analysis metrics like a health checkup for your website. Just as your doctor looks at different vital signs to understand your overall health, these key performance indicators reveal how well your site is performing and where it needs attention.
The beauty of these metrics lies not in the numbers themselves, but in the story they tell about your visitors’ experience. When you understand what each metric means, you can spot problems before they hurt your business and identify opportunities that your competitors might miss.
Key Metrics in Website Traffic Analysis
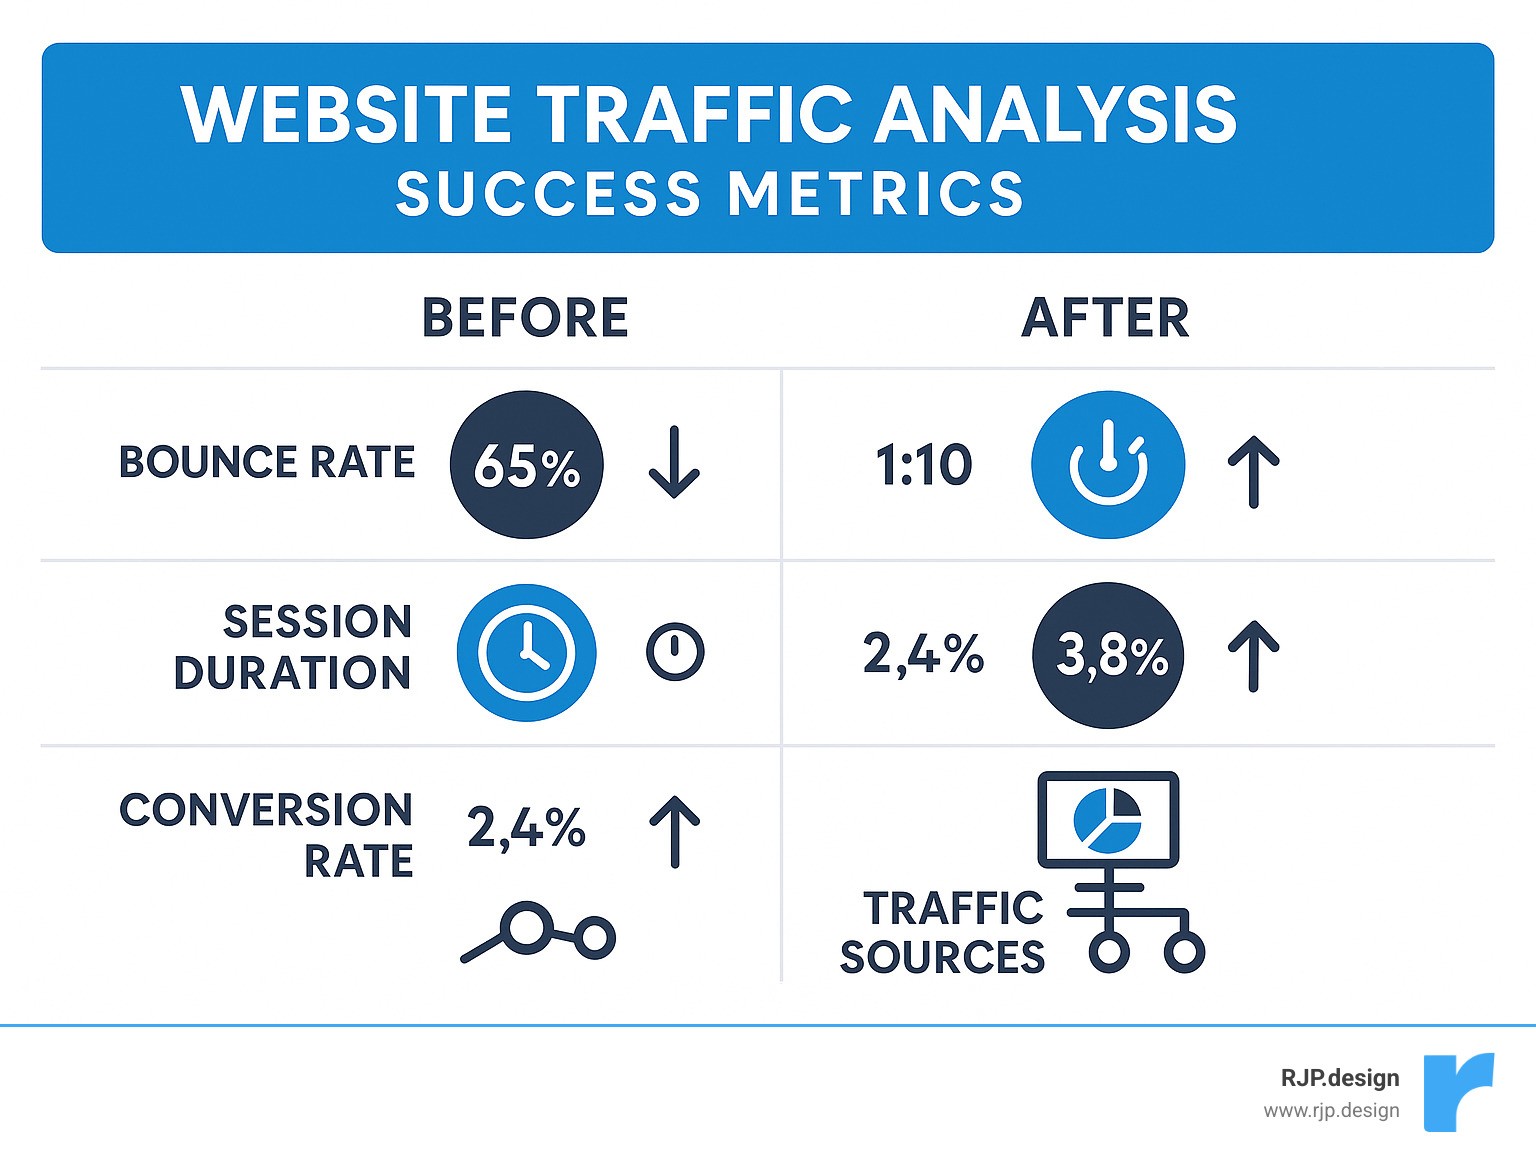
Bounce rate tells you how many visitors leave your site after viewing just one page. Picture this: someone walks into your store, looks around for a few seconds, then walks right out. That’s essentially what a bounce means online.
The average bounce rate hovers around 40%, but don’t panic if yours is higher. What matters more is understanding why people are bouncing. Sometimes it’s actually good news – if someone finds exactly what they need on your landing page and converts immediately, that counts as a bounce even though it’s a successful visit.
Pages per session reveals how engaged your visitors are with your content. When someone explores multiple pages during their visit, it usually means they’re genuinely interested in what you offer. The research shows that analyzing this metric alongside your traffic sources helps identify which marketing channels bring the most engaged visitors.
If your average sits around 1.29 pages per session, there’s real opportunity for improvement. Better internal linking, related content suggestions, and clearer navigation can dramatically increase this number.
Conversion rate is where the rubber meets the road. This metric shows what percentage of visitors take the action you want – whether that’s making a purchase, filling out a contact form, or downloading a resource. While an average click-through rate of 4% might seem modest, when paired with strong conversion rates, it often indicates you’re attracting highly qualified traffic.
Audience & Device Insights
Your audience data reveals fascinating insights about who’s actually visiting your site. The mobile versus desktop split has become crucial since mobile devices now account for the majority of web traffic. This isn’t just a nice-to-know statistic – it should directly influence your design priorities and development decisions.
Geographic location data shows you where your audience concentrates geographically. This information helps inform your content strategy and can reveal unexpected market expansion opportunities. You might find that a significant portion of your traffic comes from a region you hadn’t considered targeting.
The new versus returning visitor ratio acts like a loyalty meter for your brand. A healthy mix typically shows 60-70% new visitors finding your business for the first time, balanced with 30-40% returning visitors who found enough value to come back. If your returning visitor percentage is too low, it might signal that your content isn’t compelling enough to bring people back.
Traffic Source Breakdown
Understanding where your visitors come from is like having a map of your marketing effectiveness. Each traffic source tells a different part of your business story.
Organic search traffic reflects how well your SEO efforts are working and whether your content matches what people are actually searching for. When this number grows consistently, it usually means you’re building real authority in your industry.
Paid search results show whether your advertising campaigns are reaching the right people with the right message. Social media traffic indicates how well your brand resonates with communities and how effectively your content gets shared.
Direct traffic suggests strong brand recognition – these are people who typed your website address directly into their browser or had it bookmarked. Referral traffic reveals partnership opportunities and shows which other websites are sending visitors your way.
The key isn’t having perfect numbers in every category, but understanding how these sources work together to grow your business. When you see the complete picture, you can make smarter decisions about where to invest your time and marketing budget.
Tools & Methods to Analyze Your Own Traffic
When it comes to website traffic analysis, your own first-party data is pure gold. Think of it this way – would you rather have someone guess how many people visited your store, or would you prefer to count them yourself? That’s exactly the difference between third-party estimates and first-party tracking.
Your own data gives you exact visitor counts, precise behavior patterns, and complete control over what you measure. No guesswork, no estimates – just the real story of how people interact with your website.
Setting Up First-Party Tracking
Getting your tracking right from the start makes all the difference. Proper tag implementation means installing tracking codes correctly across every page of your website. It might sound technical, but think of it like putting a visitor counter at every door of your business.
Modern websites need to respect user privacy while still gathering valuable insights. Consent mode lets you collect data ethically while following privacy laws. Your visitors appreciate the transparency, and you still get the information you need to improve their experience.
Custom events are where the magic happens. These track the actions that actually matter to your business – when someone fills out a contact form, downloads your guide, or watches your video. These small actions often predict bigger ones, like making a purchase or becoming a long-term customer.
Interpreting Reports in GA4
Google Analytics 4 can feel overwhelming at first, but the real-time view is incredibly useful. You can watch visitors explore your site right now, which is perfect for seeing how a new blog post or campaign performs immediately.
The engagement overview tells you the complete story of how visitors interact with your content. Meanwhile, funnel analysis shows you exactly where potential customers drop off. It’s like having a map of your customer’s journey with big red X’s marking the trouble spots.
Scientific research on GA setup confirms that proper configuration dramatically improves both data accuracy and the quality of insights you can act on.
Enhancing Insights with Heatmaps
Traditional analytics tell you what happened, but heatmaps show you why it happened. They reveal where users actually click, how far down the page they scroll, and which elements grab their attention.
Scroll maps answer a crucial question – do people actually see your most important content? If your call-to-action button is below where most people stop scrolling, that’s valuable information. Click tracking shows you the path visitors take through your site, highlighting navigation issues you might never notice otherwise.
Building Custom Dashboards
Creating focused dashboards transforms overwhelming data into clear, actionable insights. Instead of drowning in numbers, you see exactly what matters to your business goals.
At RJP.design, we help clients build Website Marketing Solutions that connect traffic data directly to business outcomes. This creates crystal-clear visibility into what actually drives growth for your specific business.
Data visualization turns complex metrics into charts and graphs that make sense at a glance. KPI alerts act like your personal assistant, notifying you immediately when something important changes – whether it’s a traffic spike from a viral post or a sudden drop that needs attention.
Data Type | First-Party | Third-Party |
|---|---|---|
Accuracy | Exact visitor counts | Statistical estimates |
Data Control | Complete ownership | Limited access |
Privacy Compliance | Full control | Depends on provider |
Cost | Free (GA4) or subscription | Usually subscription-based |
Competitor Analysis | Own site only | Any website |
Competitive Traffic Intelligence
Understanding what your competition is doing online gives you a huge advantage. Think of it like peeking over the fence to see how your neighbor’s garden grows so well. Website traffic analysis isn’t just about your own site – it’s about understanding your entire market landscape.
Scientific research on traffic estimation accuracy reveals something important: third-party tools work best for websites getting between 5,000 to 100,000 monthly visitors. Outside this range, the numbers get fuzzy, but the trends still tell a valuable story.
The real power comes from benchmarking your performance against others in your industry. When you see market share shifts or find gap analysis opportunities, you’re looking at your roadmap for growth. These insights often reveal keyword opportunities and backlink insights that can transform your online presence.
How to Analyze Competitors’ Website Traffic
Here’s the thing about competitive traffic analysis – it’s like being a detective with digital clues. Public estimations come from various sources, including Chrome extensions and clickstream models that track user behavior across the web.
These tools collect data from browser extensions, mobile apps, and partnerships with data providers. They use smart algorithms to estimate traffic patterns from sample data. It’s not perfect, but it gives you directional insights that are incredibly valuable.
The secret is focusing on trends rather than exact numbers. If a competitor’s traffic suddenly jumps 200%, they probably launched something successful. Maybe it’s a viral blog post, a new product, or they landed some powerful backlinks. These patterns show you what’s working in your industry.
Don’t get hung up on whether they have exactly 50,000 or 55,000 monthly visitors. Instead, watch for traffic spikes, seasonal patterns, and growth trends that reveal their strategy.
Finding High-Value Keywords
This is where competitive intelligence gets exciting. SERP analysis shows you which keywords drive real traffic to your competitors’ websites. When you find keywords that send thousands of visitors to their site but don’t appear anywhere in your content, you’ve struck gold.
Content gaps become obvious when you see competitors ranking for terms you never considered. Maybe they’re getting traffic for “how to” guides while you only focus on product pages. These findies often lead to the biggest wins.
CPC insights from paid search data tell you which keywords have commercial value. If competitors are paying $5 per click for certain terms, those keywords probably convert well. This information helps you prioritize which content to create first.
The beauty of this approach is that your competitors have already done the expensive testing. They’ve figured out which keywords work, which content formats rank well, and which topics their audience cares about.
Identifying Referral & Backlink Opportunities
Backlink analysis reveals the relationships your competitors have built. When you see which high-authority domains link to them, you’re looking at potential partnership prospects for your own business.
Domain authority and link equity analysis help you prioritize your outreach efforts. Instead of randomly reaching out to websites, you can focus on the ones that already link to businesses like yours. These sites have already shown they’re willing to link to your industry.
Partnership prospects often emerge from this analysis. Maybe competitors get links from industry publications, local business directories, or supplier websites. Each of these represents an opportunity you can pursue with better content or stronger relationships.
The goal isn’t to copy what competitors do – it’s to understand the landscape so you can do it better. When you know where they get their traffic and links, you can create superior content and build stronger relationships that drive even better results.
Turning Data into Action: Strategy Improvements
Website traffic analysis only creates value when it drives strategic decisions. Here’s how to transform insights into growth.
Prioritizing Quick Wins
Start with low-hanging fruit that delivers immediate impact:
Page Speed Optimization – If your average session duration is only 1 minute 11 seconds, faster loading pages could significantly improve engagement
Meta Tag Optimization – Improving title tags and descriptions can boost click-through rates from search results
Internal Linking – Better navigation between related content increases pages per session
Focus on improvements that address your biggest performance gaps first. If your bounce rate exceeds 80%, user experience issues likely need immediate attention.
Long-Term Growth Tactics
Sustainable growth requires strategic thinking beyond quick fixes:
Topic Clusters organize your content around central themes, improving both user experience and search engine rankings. When visitors find comprehensive information on your site, they’re more likely to convert and return.
Omnichannel Campaigns leverage insights from traffic source analysis to create coordinated marketing efforts across channels. If social media drives awareness but email converts better, design campaigns that move prospects through this journey.
At RJP.design, our Google Search Optimization services help businesses implement these long-term strategies based on solid traffic analysis foundations.
Measuring Impact & Iterating
Establish clear OKRs (Objectives and Key Results) tied to traffic metrics that matter for your business. Create dashboards that track progress toward these goals, and implement continuous testing to validate improvements.
Regular analysis cycles help you spot trends early and adjust strategies before small issues become major problems. The most successful businesses treat website traffic analysis as an ongoing process, not a one-time audit.
Frequently Asked Questions about Website Traffic Analysis
How accurate are third-party traffic estimations?
The truth about third-party traffic tools might surprise you. These estimations work best for websites in that sweet spot of 5K-100K monthly visitors, where the data can be remarkably close to what you’d see in your actual analytics dashboard.
But here’s the catch – these tools rely on statistical modeling and sampling from browser extensions and app data. Think of it like polling before an election. The sample might be representative, but it’s still just a sample.
For smaller websites or massive sites with millions of visitors, the accuracy drops off significantly. That’s why I always tell clients to focus on trends and patterns rather than getting hung up on exact numbers. If a competitor’s traffic suddenly jumps 300%, that’s meaningful whether the actual number is 10,000 or 15,000 visitors.
The key is using these insights for strategic direction, not precise planning. Website traffic analysis from third-party tools excels at revealing opportunities and competitive shifts, even if the numbers aren’t perfect.
How often should I run a full traffic audit?
This depends on your business size and how quickly things change in your industry, but here’s what works for most businesses.
Quarterly comprehensive audits give you the deep dive you need without overwhelming your team. These should cover everything – traffic sources, user behavior, conversion funnels, and competitive positioning.
Between those major audits, monthly reviews keep you on track. Focus on your core KPIs and watch for any significant changes that need immediate attention.
For active campaigns or seasonal businesses, weekly monitoring helps you catch issues early and optimize performance while campaigns are still running.
The real game-changer? Set up automated alerts for dramatic changes. If your traffic drops 50% overnight or your bounce rate suddenly spikes, you want to know immediately, not next month during your scheduled review.
Which metrics signal it’s time to redesign my site?
Your website might be silently pushing customers away, and the data will tell you before your sales numbers do.
Bounce rates consistently above 70% are a red flag. When visitors leave immediately after arriving, they’re probably not finding what they expected or your site isn’t user-friendly enough to keep them engaged.
Low pages per session (under 2) suggests people aren’t exploring your content. Either your navigation needs work, or your content isn’t compelling enough to draw visitors deeper into your site.
Here’s one that catches many businesses off guard – poor mobile performance compared to desktop. If desktop users browse 3 pages per session but mobile users barely make it past one, your mobile experience needs serious attention.
Growing traffic but stagnant conversions is perhaps the most frustrating signal. More visitors should mean more customers, but if your conversion rate keeps dropping as traffic grows, your site isn’t scaling with your audience’s needs.
The bottom line? When website traffic analysis shows consistent problems across multiple metrics, a redesign often delivers better ROI than trying to patch individual issues. Sometimes starting fresh creates the breakthrough your business needs.
Conclusion
Website traffic analysis transforms guesswork into strategy, revealing exactly how to improve your digital presence and drive business growth. The data shows that successful businesses continuously monitor their traffic patterns, understand their audience behavior, and make strategic decisions based on solid insights rather than assumptions.
Think of traffic analysis as your business compass. It points you toward what’s working and steers you away from what isn’t. When you see that mobile visitors have a 70% bounce rate while desktop users engage deeply with your content, you know exactly where to focus your efforts.
The real magic happens when you turn insights into action. Analysis without implementation creates no value. Use these insights to optimize your content, improve user experience, and allocate marketing resources where they’ll have the greatest impact. Whether you’re fixing a high bounce rate or identifying new keyword opportunities, let data guide your decisions rather than hunches.
Data-driven growth isn’t just about collecting numbers – it’s about understanding the story those numbers tell. Your traffic patterns reveal customer preferences, content gaps, and untapped opportunities that can transform your business outcomes.
At RJP.design, we specialize in helping businesses turn traffic insights into tangible results. Our team combines technical expertise with strategic thinking to ensure your website not only attracts visitors but converts them into customers. We’ve seen how the right website traffic analysis approach can transform struggling websites into customer magnets.
If you’re ready to open up the full potential of your website data, explore our Digital Marketing services to see how we can help transform your digital presence. Our down-to-earth team prioritizes your success, turning complex analytics into clear action plans that drive real growth.
The path from clicks to insights starts with understanding your data, but it leads to measurable business growth when you take strategic action based on what you learn. Your website has stories to tell – let’s help you listen to what it’s saying.

